


More than you might think…
At first glance, the extravagance and glamour of the fashion industry seems entirely opposed to the serious and sombre world of finance. Fashion shows are sometimes so over the top that they defy any attempt at parody. Financial expos on the other hand can be so mind-numbingly tedious that they make attendees wish they had chosen different career paths.
So what is the connection? The answer lies in economic indicators.
Economists love indicators. Everyone has heard of the Purchasing Managers’ Index (PMI) and the Consumer Price Index (CPI), but there are many more out there, such as the Big Mac Index or even the Guns to Caviar Ratio. Some are clearly more serious than others. Economists routinely pluck data from a number of different sectors and the fashion industry is no exception. Here are some tailor-made indicators sewn into the world of fashion.
1. The Hemline index
The Hemline index dictates that during times of financial growth, skirts get shorter; during times of hardship, they get longer. This trend was first observed in America all the way back in the 1920s. This period is referred to as the roaring 20s for good reason. The decade was characterised by massive growth, prosperity and consumerism. The boom was not limited to economic factors however, the 1920s saw the rapid development of technology, music, arts and of course… fashion.
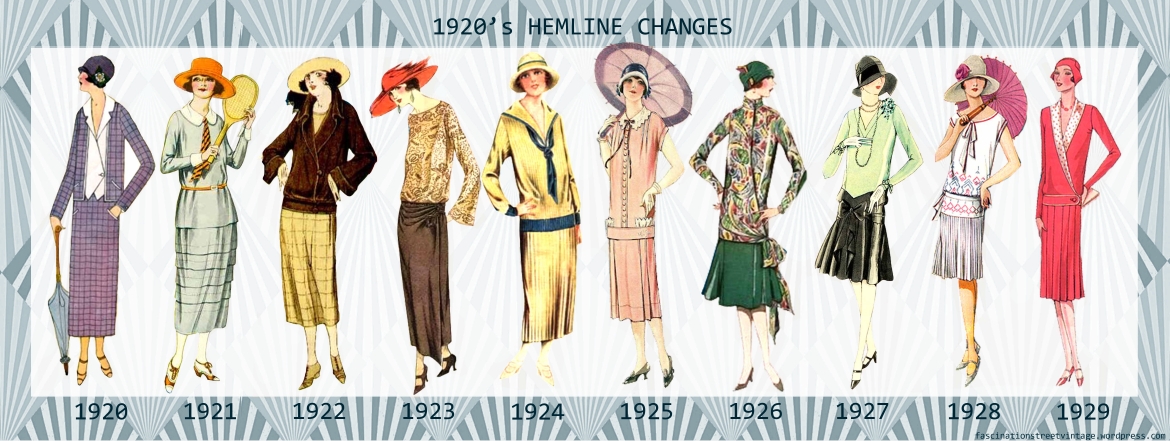
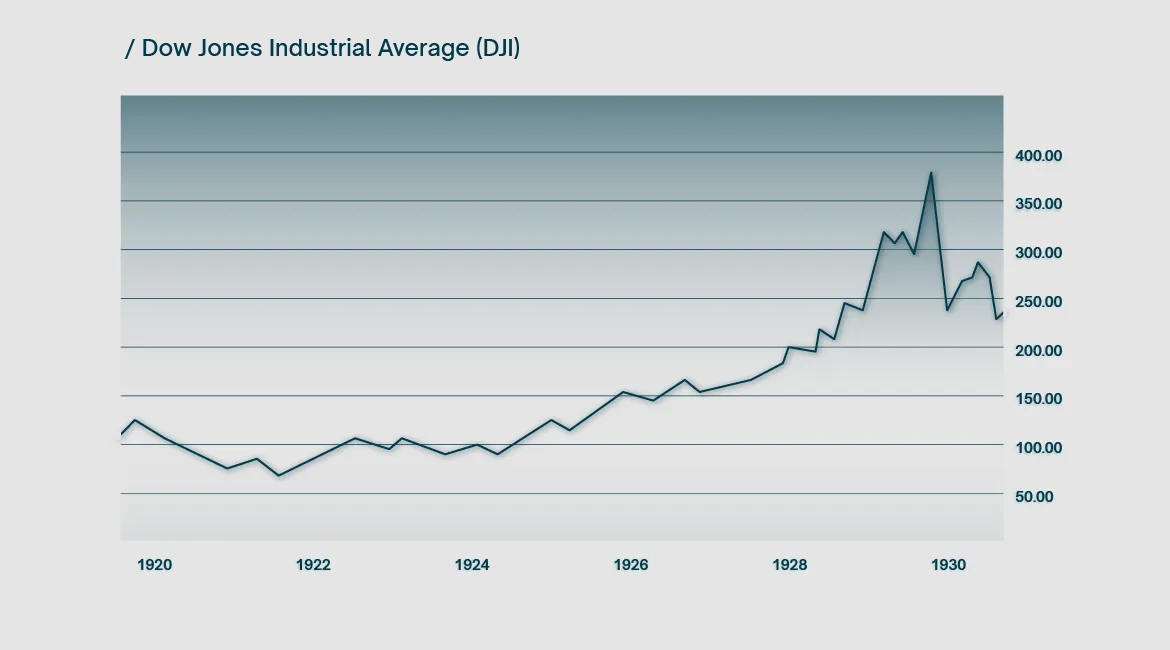
Interestingly, women’s skirts followed the same rise and fall as the stock market. Looking at the Dow Jones Industrial Average and the length of women’s skirts shows a clear link. At the beginning of the decade, skirts barely rose off the ground. By 1926, skirts were short enough to reveal the knee and stayed that way until 1929.
It was an exciting time to be alive, but as with all good things, it came to a crushing end. The roaring 20s culminated in the stock market crash of 1929, resulting in both the Dow and hemlines dropping precipitously. Traders and perverts both suffered a devastating blow.
The roaring 20s quickly gave way to the great depression which characterised much of the 1930s. The financial landscape changed dramatically for the worst and fashion sensibilities reflected this. Dresswear returned to a more formal style and hemlines stayed low for the entire decade.
With the advent of the Second World War, fashion took an understandable step back. Wartime economies took over and a huge number of women entered the workforce. Out of necessity, women’s clothes became more functional, knee-length skirts became the norm but offered very little in terms of flair. Although somewhat of a special case, wartime economies generated considerable growth and women’s clothes reflected the robust nature of the time.
By the 1950s, people were practically begging for a little extravagance. They would get it in spades. The post-war economic boom, particularly in America, saw a healthy injection of elegance into the world of fashion. Layered skirts, poodle skirts and cocktail dresses were all the rage. Financial markets were booming again, and hemlines would rise along with them. By the 1960s modesty went out of the window completely and women were showing more of their legs than ever before. Economic largesse pushed the boundaries of fashion to create the mini-skirt. Hurray.
The decades that follow are a little harder to track. Fashion became much faster from the 70s onwards. New trends would spring up seemingly overnight only to disappear within a season. Culturally, society was also much less uniform. Distinct cliques appeared, each with their own dress sense. The hemline trend became muddier from this point onwards.
Like all such indices, the Hemline Index is kind of half way between a joke and a genuine economic indicator. Nevertheless, a group of researchers in Rotterdam with far too much time on their hands looked at the data and concluded that there is indeed a link between situation of the time. Not only that, but they discovered that there is a three-year lag between the two.
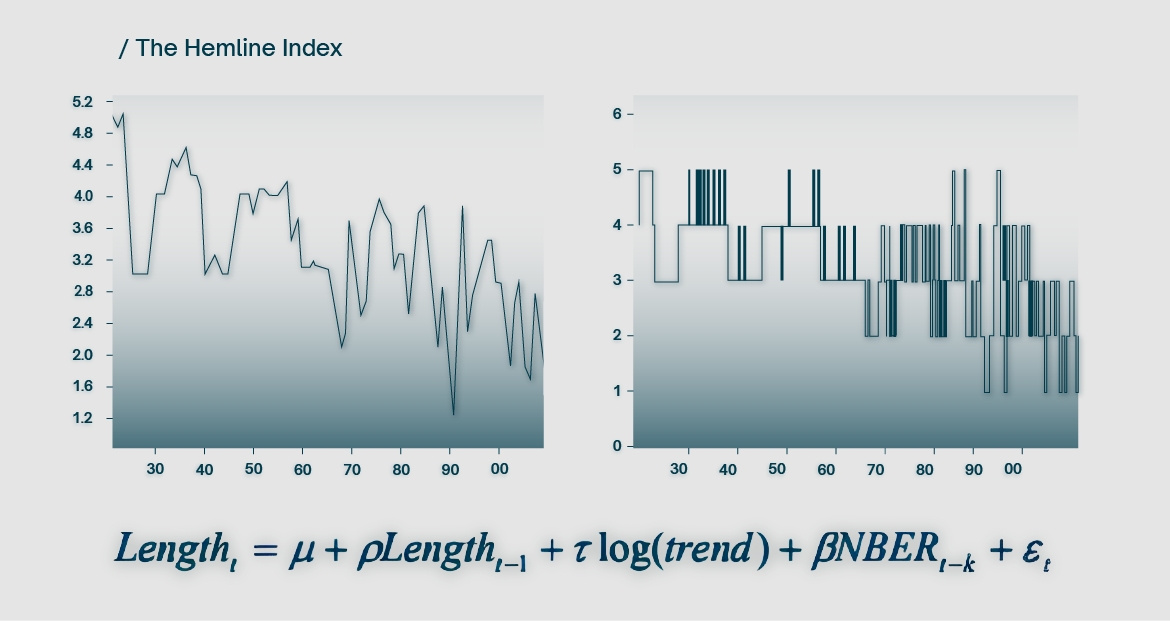
Unfortunately for traders, the market moves first, making all this research useless for predicting market movements.
The connection between finance and fashion is not merely limited to clothes but extends to make-up as well. The lipstick index is a bit of a strange phenomenon: it states that during times of economic downturn, lipstick sales actually increase. The term was first coined by Leonard Lauder, chairman of the board and son of Estée Lauder. He made the claim in the early 2000s that there was an inverse correlation between cosmetic sales and the wider economy.
The Dot-com bubble burst in 2000, leading to a period of brief economic decline. During the same period, sales of lipstick and other basic make-up items actually increased. Lauder speculated that during times of hardship, women tend to forgo more expensive fashion accessories and jewellery in favour of more simple and high-impact items like lipstick.
About ten years later, in the 2010s, people began to dismiss the index as a silly idea. Ah yes, the lipstick index, how ridiculous! The nail polish index on the other hand, now that’s the kind of serious indicator the world of economics yearns for. The nail polish index did indeed gain traction for a while, following the same rationale, but similarly fell out of use after a few short years.
One more attempt was made to resurrect the concept, in the form of the mascara index. This occurred during the Corona virus pandemic, which prompted the worldwide widespread use of masks. What’s the point of using lipstick when wearing a mask all day? Absolutely no point. Mascara however? Just visible enough to justify the extra expense.
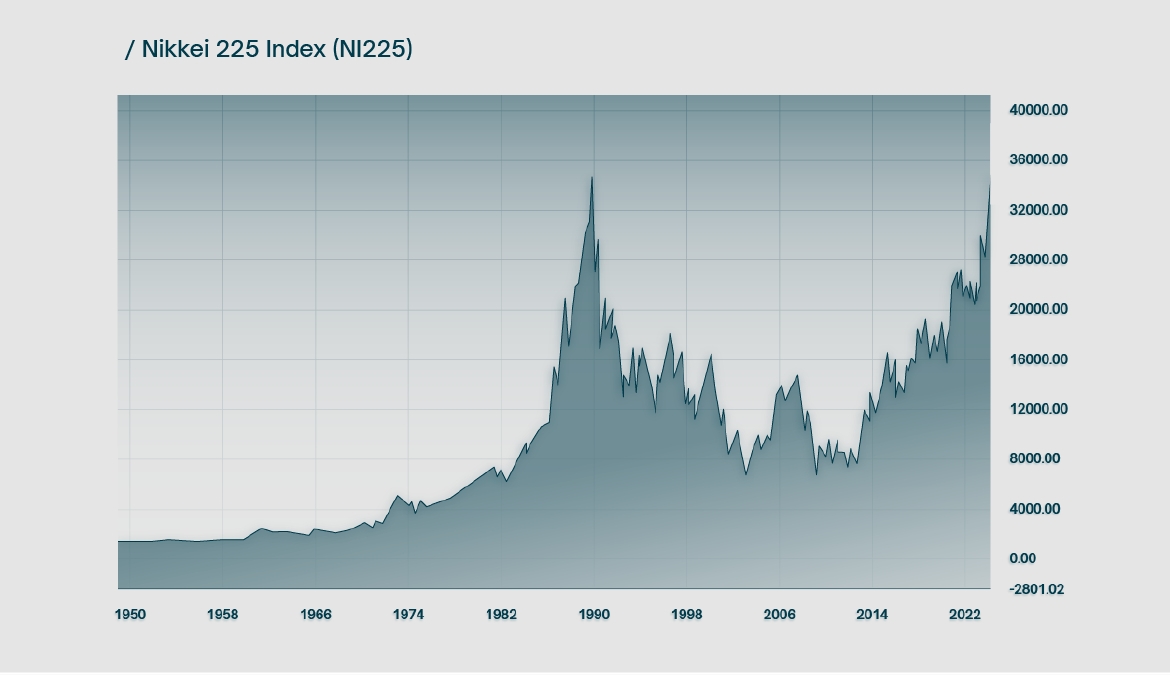
We now push the connection between finance and fashion one step further, this time expanding into the sacred realm of the hair salon. Japan serves as the stage for this one. The Japanese post-war economic boom came to a brutal halt in the late 1980s, resulting in a market crash that would take decades to recover from. The Nikkei 225 peaked in December 1989 and wouldn’t see such valuations again until 34 years later.
For Japan, the 1990s could not have contrasted more starkly with the previous decade. The financial fallout was obvious to see, but once again, many other aspects of society and culture followed suit. One observable element was the length of women’s hair: after the crash, hair noticeably shortened. There is an obvious explanation for this: haircare products cost money. Shorter hair is cheaper and easier to maintain.
An attempt to quantify the phenomenon was made by Kao Corporation, one of the leading cosmetics companies in Japan. The results, published by Nikkei Business Daily, claimed that up until 1990, 60% of women in their twenties kept their hair long. Following the stock market crash, short hair became the dominant style.
In the years that followed, long hair would gradually some back in style, reflecting the growth in the Nikkei from 2010 onwards.
As we begin to scrape the bottom of the barrel of financial indicators, we stumble across the Sports Illustrated magazine, in particular the swimsuit edition, more precisely the model on the front cover. Unlike previous entries, this indicator actually seems to have some predictive power. The theory goes that the nationality of the model on the front cover of the magazine predicts the performance of the S&P 500. If the model is American, the S&P 500 performs well; if the model is of a different nationality, the index will underperform.
The index has been retroactively calculated back to 1978 and the results are indeed impressive. Between 1978 and 2008, the S&P 500 averaged a 10.5% annual return. Around half of those years featured an American model and during those years average return rose to 14%. In contrast, the years featuring a model from outside of the US produced an average return of just 7.2%. Not a bad correlation at all. Beats most hedge funds.
Unfortunately, 2008 was a terrible year for the index. Sports Illustrated featured American model Marissa Miller on the front cover that year, only for stock markets to undergo one of the worst sell-offs in history a few months later. Can’t win them all.
Conclusion
Looking at charts all day, it is easy to forget that the numbers on the screen do in fact have real world equivalents. Stock markets are not isolated entities. The rise and fall of asset prices have a profound effect on our lives. The roaring 20s encapsulated a genuine cultural revolution that changed the world forever. The 60s likewise permanently shifted societal norms. In Japan, the implosion of the Nikkei in 1989 had a profound impact on the nation, its people, and its culture. The financial crisis of 2008 likewise left an indelible mark on the world, affecting the global monetary framework to this day. With such far reaching effects, is it any wonder that the whimsical fashion industry is one of the first to reflect the economic conditions of the time?


Amaran Risiko : Perdagangan derivatif dan produk berleveraj mempunyai tahap risiko yang tinggi.
BUKA AKAUN


