


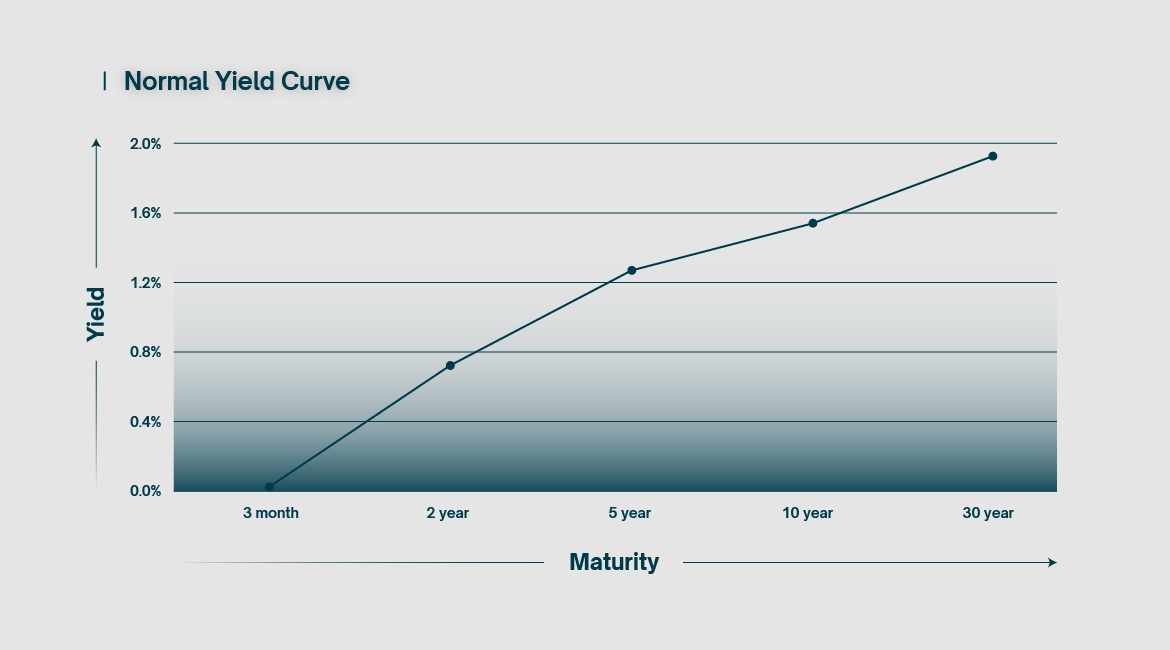
Simply put, the yield curve charts the yield earned on a
bond against its time to maturity. It is a snapshot in time and changes shape
regularly. Typically, the longer it takes a bond to mature, the better the
yield. This is hardly surprising; if an investor buys a ten-year bond as
opposed to a one-year bond, they should expect to receive a greater reward for
doing so, otherwise why bother? This creates an upward sloping chart,
considered a “normal” yield curve.
Due to market dynamics, yields on bonds are heavily tied to
interest rates at large. The shorter the time to maturity, the tighter the
correlation to the target interest rate set by the central bank of a nation.
Short-term bonds, typically under one year to maturity, are used as a benchmark
to price short-term borrowing and deposit rates. Longer-term bonds, typically a
minimum of ten years to maturity, reflect the longer-term costs of borrowing
and lending, such as for a mortgage.
The yield curve is a useful tool to quickly gauge interest
rates over time, but also offers a glimpse into the confidence that investors
have in a given economy. Put simply, if investors are losing confidence in the
nation’s economic performance, they will prefer to divert funds to safer but
lower-yielding, longer-term investments, such as bonds with 10+ year
maturities. Due to increased demand, these long-term bonds increase in price,
thereby lowering their yield (see part I for a more detailed explanation on
this). This pushes the right side of the curve downwards.
The opposite is also true. Confidence in the economy
translates to reduced demand in long-term bonds, because investors think they
can get a better return on investment in equities or other short-term
investments. Due to decreased demand, long-term bonds decrease in price,
thereby increasing their yield. This pushes the right side of the curve
upwards.
When reading financial news, one is likely to stumble upon
chatter relating to the ten-year US treasury yield. This financial instrument
is considered a particularly important benchmark for investors, given its
impact on long-term borrowing rates and its susceptibility to global
geopolitical sentiment. Variations in yield are reflective of variations in
demand, which in turn give a reliable indication of overall market sentiment.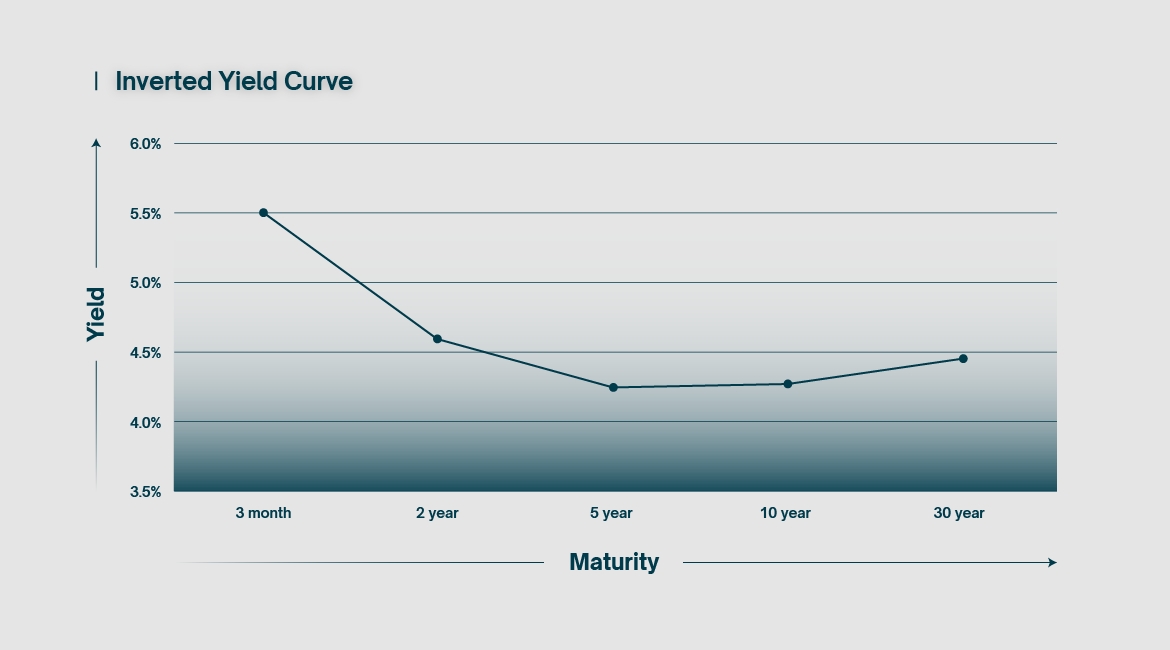
In rare cases, the bond market can experience something
called a yield curve inversion. This means that short-term interest rates
overtake long-term ones. We now have a chart that slopes downwards on at least
part of the curve. This is something that has occurred recently in some parts
of the world, due to central banks rapidly increasing interest rate targets to
contain inflation. One of the effects of such a policy was to drag short-term
bond yields above their longer-term counterparts.
On the surface this doesn’t make sense. How can investors
earn a better yield for a shorter commitment? Why would anyone bother buying
long-term bonds in such a situation? The answer is that those long-term rates
are locked in for longer. No one knows how long the short-term high yields will
last. An investor would have to constantly renew their position in the
short-term bond market to maintain the high yield, which could go down at any
time. This is called reinvestment risk and is a critical part of any trading
strategy for larger investment firms.
During times of high interest rates, short-term investments
are typically not as lucrative, due to a stronger currency and a restricted
money supply. As explained above, a lack of economic confidence tends to put
more buying pressure on longer-term investments, essentially reallocating money
from the present and pushing it into the future. The inverted yield curve
illustrates this phenomenon. So much so that an inversion of the yield curve
has been a historically consistent predictor of economic recession.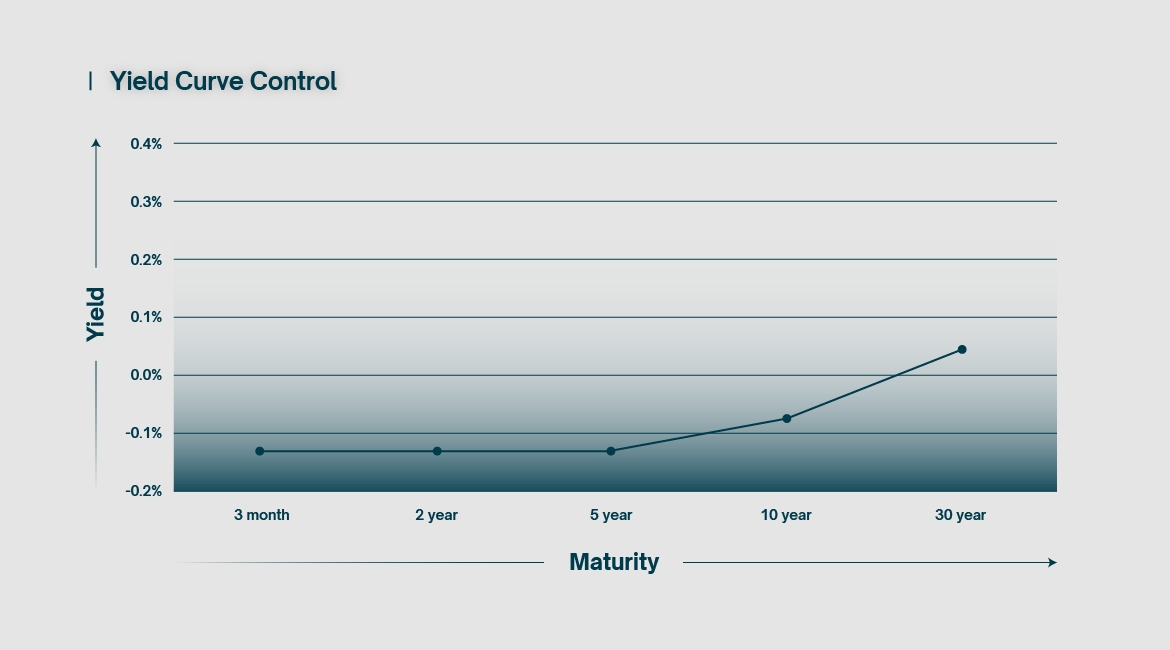
The first two charts result from somewhat natural market
dynamics. In contrast, the above chart is what happens when the central bank
takes full control of the bond market by employing a tool called yield curve
control. Yield curve control refers to the practice of a central bank
purchasing bonds of specific lengths with the express purpose of lowering their
respective yields to predefined targets. In essence, every central bank employs
some form of YCC, although they are typically targeting the short end of the
curve.
In the modern era, the term yield curve control is almost
exclusively used in the context of the Japanese economy, as a result of the
very specific conditions it has undergone since the 1990s. In an effort to drag
the nation out of decades of stagnation, the Bank of Japan sought to inject
some much-needed liquidity into its economy via the mass-purchasing of bonds
and other assets. Money was pumped into the Japanese banking system and
interest rates were pushed to zero and even below. Bond yields were crushed
across the board, suppressing the yield curve on all timeframes in an effort to
stimulate investment and growth in the beleaguered economy.
Unfortunately, this presented a particular problem for
longer-term interest rates and their influence on things like pensions and
mortgages. Many parties were understandably angry about the fact that long-term
bonds were no longer yielding any kind of return on investment. In an effort to
correct this, the Bank of Japan later allowed rates on higher timeframe bonds
to rise slightly, while keeping yields on short-term bonds strictly below zero.
Essentially, the yield curve was precisely tailored to specific targets, via
the controlled purchasing of bonds by the central bank, hence the term yield
curve control.
The use of yield curve control briefly gained more
international traction during the Covid years, but remains a relatively novel
and experimental tool. Even Japan has now abandoned the practice.
In
conclusion, the yield curve quite literally paints the monetary landscape at a
particular moment in time, offering insight into investor sentiment across a
large timespan. As useful a tool as this is, it remains at least partially open
to interpretation. Monetary policy has changed greatly in recent years, particularly
since the 2008 financial crisis. As the monetary frameworks within which our
economies operate continue to evolve, so too will our understanding of this
vital tool.


Risk Warning : Trading derivatives and leveraged products carries a high level of risk.
OPEN ACCOUNT


