


April 25, 2024
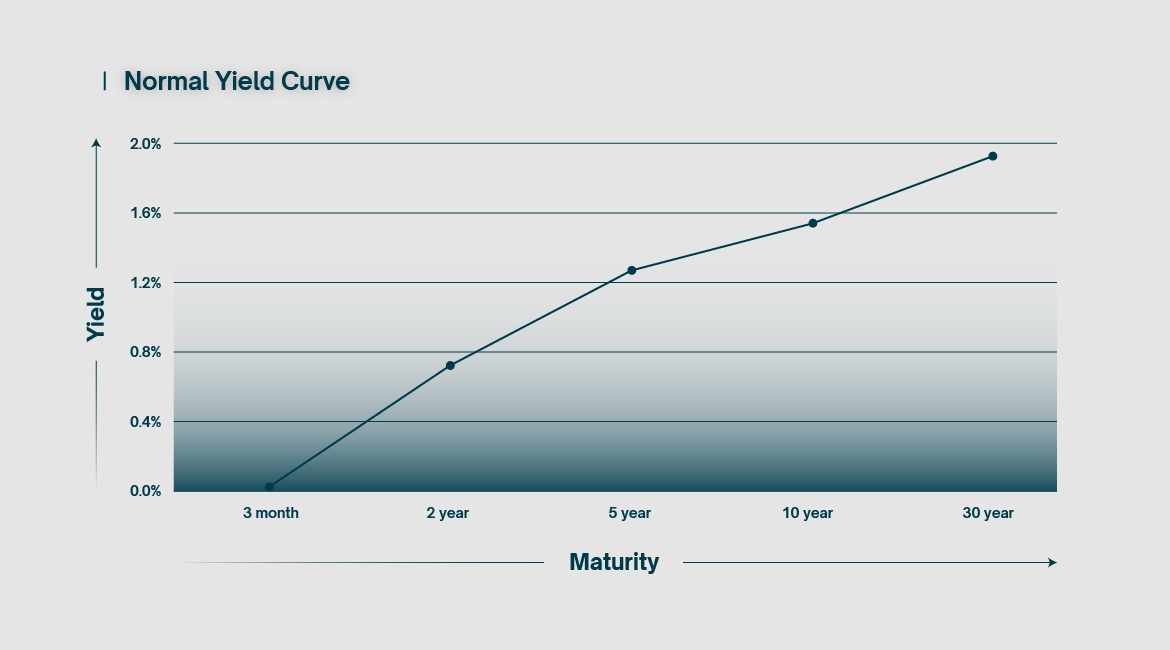
Simply put, the yield curve charts the yield earned on a
bond against its time to maturity. It is a snapshot in time and changes shape
regularly. Typically, the longer it takes a bond to mature, the better the
yield. This is hardly surprising; if an investor buys a ten-year bond as
opposed to a one-year bond, they should expect to receive a greater reward for
doing so, otherwise why bother? This creates an upward sloping chart,
considered a “normal” yield curve.
Due to market dynamics, yields on bonds are heavily tied to
interest rates at large. The shorter the time to maturity, the tighter the
correlation to the target interest rate set by the central bank of a nation.
Short-term bonds, typically under one year to maturity, are used as a benchmark
to price short-term borrowing and deposit rates. Longer-term bonds, typically a
minimum of ten years to maturity, reflect the longer-term costs of borrowing
and lending, such as for a mortgage.
The yield curve is a useful tool to quickly gauge interest
rates over time, but also offers a glimpse into the confidence that investors
have in a given economy. Put simply, if investors are losing confidence in the
nation’s economic performance, they will prefer to divert funds to safer but
lower-yielding, longer-term investments, such as bonds with 10+ year
maturities. Due to increased demand, these long-term bonds increase in price,
thereby lowering their yield (see part I for a more detailed explanation on
this). This pushes the right side of the curve downwards.
The opposite is also true. Confidence in the economy
translates to reduced demand in long-term bonds, because investors think they
can get a better return on investment in equities or other short-term
investments. Due to decreased demand, long-term bonds decrease in price,
thereby increasing their yield. This pushes the right side of the curve
upwards.
When reading financial news, one is likely to stumble upon
chatter relating to the ten-year US treasury yield. This financial instrument
is considered a particularly important benchmark for investors, given its
impact on long-term borrowing rates and its susceptibility to global
geopolitical sentiment. Variations in yield are reflective of variations in
demand, which in turn give a reliable indication of overall market sentiment.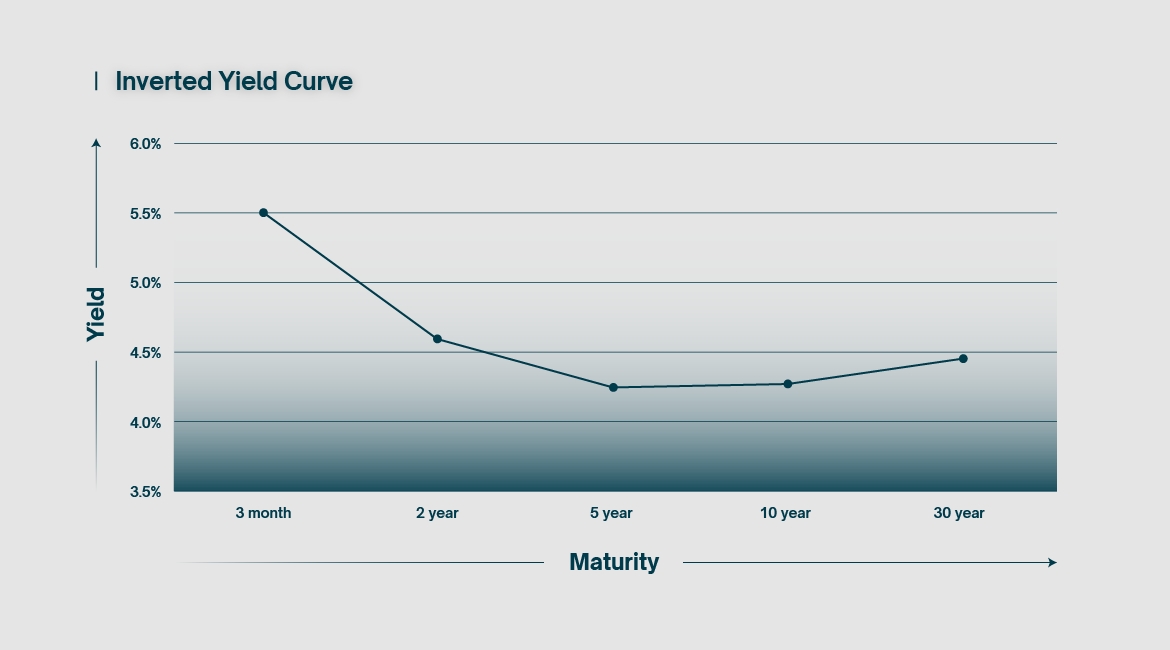
In rare cases, the bond market can experience something
called a yield curve inversion. This means that short-term interest rates
overtake long-term ones. We now have a chart that slopes downwards on at least
part of the curve. This is something that has occurred recently in some parts
of the world, due to central banks rapidly increasing interest rate targets to
contain inflation. One of the effects of such a policy was to drag short-term
bond yields above their longer-term counterparts.
On the surface this doesn’t make sense. How can investors
earn a better yield for a shorter commitment? Why would anyone bother buying
long-term bonds in such a situation? The answer is that those long-term rates
are locked in for longer. No one knows how long the short-term high yields will
last. An investor would have to constantly renew their position in the
short-term bond market to maintain the high yield, which could go down at any
time. This is called reinvestment risk and is a critical part of any trading
strategy for larger investment firms.
During times of high interest rates, short-term investments
are typically not as lucrative, due to a stronger currency and a restricted
money supply. As explained above, a lack of economic confidence tends to put
more buying pressure on longer-term investments, essentially reallocating money
from the present and pushing it into the future. The inverted yield curve
illustrates this phenomenon. So much so that an inversion of the yield curve
has been a historically consistent predictor of economic recession.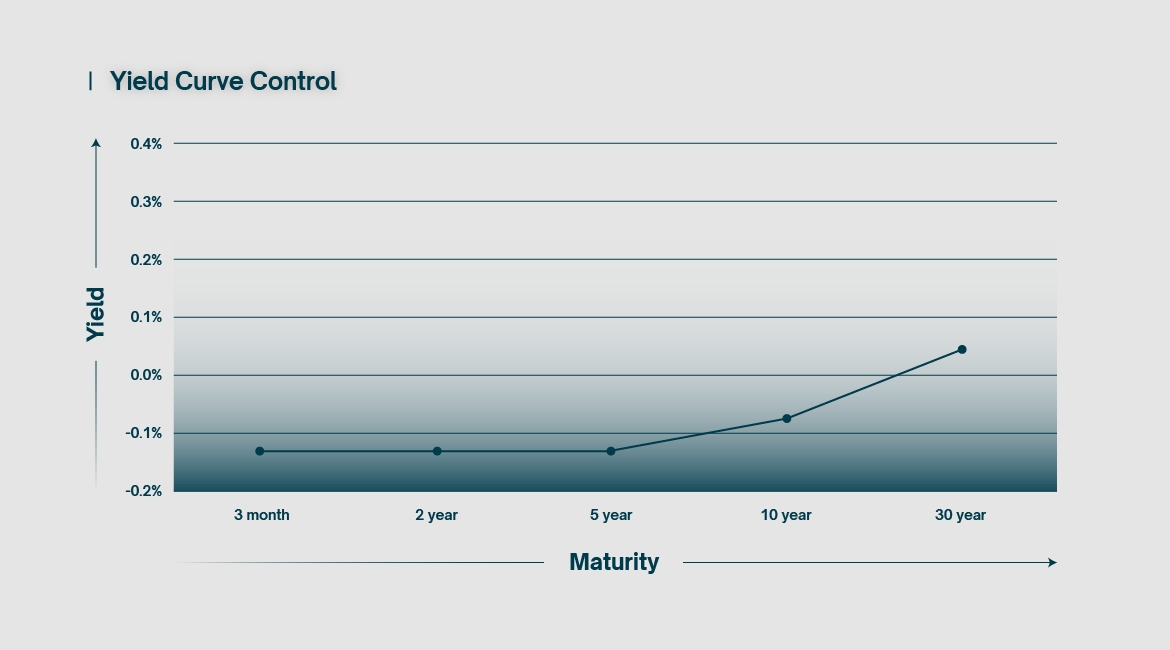
The first two charts result from somewhat natural market
dynamics. In contrast, the above chart is what happens when the central bank
takes full control of the bond market by employing a tool called yield curve
control. Yield curve control refers to the practice of a central bank
purchasing bonds of specific lengths with the express purpose of lowering their
respective yields to predefined targets. In essence, every central bank employs
some form of YCC, although they are typically targeting the short end of the
curve.
In the modern era, the term yield curve control is almost
exclusively used in the context of the Japanese economy, as a result of the
very specific conditions it has undergone since the 1990s. In an effort to drag
the nation out of decades of stagnation, the Bank of Japan sought to inject
some much-needed liquidity into its economy via the mass-purchasing of bonds
and other assets. Money was pumped into the Japanese banking system and
interest rates were pushed to zero and even below. Bond yields were crushed
across the board, suppressing the yield curve on all timeframes in an effort to
stimulate investment and growth in the beleaguered economy.
Unfortunately, this presented a particular problem for
longer-term interest rates and their influence on things like pensions and
mortgages. Many parties were understandably angry about the fact that long-term
bonds were no longer yielding any kind of return on investment. In an effort to
correct this, the Bank of Japan later allowed rates on higher timeframe bonds
to rise slightly, while keeping yields on short-term bonds strictly below zero.
Essentially, the yield curve was precisely tailored to specific targets, via
the controlled purchasing of bonds by the central bank, hence the term yield
curve control.
The use of yield curve control briefly gained more
international traction during the Covid years, but remains a relatively novel
and experimental tool. Even Japan has now abandoned the practice.
In
conclusion, the yield curve quite literally paints the monetary landscape at a
particular moment in time, offering insight into investor sentiment across a
large timespan. As useful a tool as this is, it remains at least partially open
to interpretation. Monetary policy has changed greatly in recent years, particularly
since the 2008 financial crisis. As the monetary frameworks within which our
economies operate continue to evolve, so too will our understanding of this
vital tool.
Gold prices suffered heavy losses early this week as tensions between Israel and Iran continued to abate. Over the weekend, Tehran stated it had no retaliatory intentions against its long-standing adversary, despite further suspected attacks on Iranian soil. The reconciliatory tone did nothing to bolster the safe-haven narrative associated with gold, which has witnessed a meteoric rise over the past couple of months. The precious metal lost 2.7% on Monday and went on to endure further selling pressure on Tuesday following an unexpected drop in business activity in the US.
The S&P Global Manufacturing PMI fell to 49.9 in April compared to 51.9 for the previous month, technically placing it in contraction. The Global Services figures also came in lower than expectations at 50.9 compared to 51.7 in March. It is the first data print to show a loss of momentum in the US economy and will offer a glimmer of hope to investors betting on the Federal Reserve to finally nudge interest rates lower. Those hoping to see a more dovish stance from the Fed will also have their gaze firmly trained on Friday’s Core PCE Price Index numbers.
The data print was enough to push the Dollar Currency Index 0.4% lower yesterday, losing the 106 level it had maintained for most of last week. Despite weakness in the Dollar, pressure on the Yen did not subside, USDJPY edging as high as 154.8 ahead of the Bank of Japan’s interest rate decision on Friday.
Earnings week is upon us for many US companies, and already traders are piling into tech stocks, triggering rallies in all major indices with the Nasdaq Composite predictably leading the way. The index clawed back a decent chunk of the gains surrendered last week, gaining 1.1% and 1.6% over the past two sessions, the S&P 500 and Dow Jones also seeing a rebound after recent poor price action.
Stock indices around the world continue their search for a floor following last month’s record highs. The tech-heavy Nasdaq Composite closed out a dismal week with a fittingly poor performance on Friday, losing 2.05% by the closing bell. Investors are perhaps wary of a slew of earnings reports due to drop this week, preferring to take money off the table for now. The S&P 500 had a similarly dour week, capping it off with a 0.88% loss on Friday. Far too early to call it a floor, but the Dow Jones Industrial Average at least attempted to hold ground last week, even managing to finish half a percent in the black during Friday’s session.
A quick glance at stocks around the world shows a comparable picture. In Japan, the Nikkei 225 lost over 1000 points on Friday, now down almost 10% from record highs. The Hang Seng Index in Hong Kong failed to keep any positive momentum going, finishing the week with a 1% loss on Friday. European indices are a bit more of a mixed bag but overall leave much to be desired.
The most obvious explanation for the global downturn is simply that traders are no longer expecting fresh liquidity to be pumped into markets any time soon. Since the start of the year, the narrative was that the economic rebound had cooled off to the point of justifying some level of monetary easing. Unfortunately, moving into Q2 the data were unable to back up such a stance. Inflation figures have consistently beaten expectations; the US labour market has been surprisingly resilient. Central banks around the world are on the back foot, forced to adopt a wait-and-see approach, leaving markets in limbo for the time being.
Government bonds are part of the long list of items that play almost no part in the lives of the average person, and yet behind the scenes they are crucial. Not only are they critical for investors, particularly the bigger investments firms, but they also shape the economic landscape of their country of issuance as well as play a pivotal role in the way a government raises funds.
So what is a bond? In the simplest terms, a bond is an IOU issued by the government. The government periodically puts bonds up for sale, with different interest rates and different maturity dates, varying from just a few months up to several decades. Investors are then free to purchase these bonds, at which point they become tradeable assets in an open market.
The exact name of this type of financial instrument differs depending on the length of time to maturity, as well as the country in which it was issued. In many parts of the English-speaking world, they are instead referred to as “gilts”. For the purpose of this article, we will employ the term “bond” as a catchall term for all such government-issued debt securities.
For longer-term bonds, the holder periodically earns a reward in the form of an interest payment, usually called the coupon. Once the bond reaches maturity, the government pays the face value back to the redeemer - typically $1000 for US bonds. Up until that point, bonds are freely tradeable and valued at whatever price the market deems appropriate.
It is important to properly define yield in the context of the bond market, because the definition differs somewhat from comparable investments. For a bond, two factors define the yield: the interest payments (coupon payments), and the spread between the purchase price and the face value of the bond.
The simplest calculation, called the current yield, is as follows:
We can see from the above formula that the yield and the price are inversely correlated, meaning that if the price of the bond were to fall, then its yield would increase. Indeed, if an investor were to purchase a $1000 bond with a 5% coupon rate (meaning a $50 payment) at face value, the current yield would also be 5%. However, if an investor were to purchase the same bond at a discounted price of $800, then the current yield would increase to 6.25%. Important to keep in mind when reading financial news relating to falling/rising yields.
Another, and more perhaps more useful calculation, is the yield-to-maturity rate, which is the total return on investment made on the bond, assuming it is held until the maturity date. Such a calculation also assumes all coupon payments are reinvested at the same rate as the bond’s current rate, making it relatively difficult to calculate and certainly falling outside of the scope of this article.
As we mentioned before, only longer-term bonds typically earn a coupon, meaning that the yield on shorter-term bonds is entirely defined by the spread between the purchase price and the face value.
For investors, the salient point about a bond is that it is a financial investment guaranteed by the government, and as such is considered the safest possible investment one could make. After all, if the government is no longer in a position to financially honour the bonds it issues, the investor will probably have much bigger problems to worry about than their portfolio.
For governments, bonds are an important part of how they fund their activities. By selling bonds, the country is essentially raising money, with the promise to pay back that money with interest further down the line. They are one of the primary tools a government uses to raise funds.
They also play another, essential role. Traditionally, a country would manipulate the strength of its currency by controlling the money supply. The more money in circulation, the weaker that money tends to be, and vice-versa. To increase the money supply, the central bank of that country would purchase government bonds, thereby injecting money into the system. Conversely, by selling those bonds, the central bank takes all that money back, reducing the supply. This is the mechanism by which a country could increase and decrease the money supply, and by doing so manipulate the relative strength of its currency.
The post-2008 modern financial era differs somewhat from this framework, but the buying and selling of bonds continues to be an important steering tool for monetary policy. To understand how, we need to look at something called the yield curve, which we will cover in part II of this article.
The backing vocalists at the Federal Reserve have stepped up to the mic, joining the hawkish chorus of voices calling to withhold interest rate cuts. Raphael Bostic chimed in on Thursday saying that inflation needs to draw closer to targets before bringing down borrowing costs. The Atlanta Fed President even went on to say that should inflation continue to veer off course then further rate hikes were not out of the question. New York Fed President John Williams echoed much of the same, saying there was no urgency to cut rates and that any decision to do so would be data-driven.
Despite a minor pullback on Wednesday, the DXY remains firmly above 106, putting pressure on other major currencies. Both the Euro and Cable are currently hovering around 6-month lows versus the Dollar, which is to say nothing of the Yen, which is now facing 35-year lows versus the greenback. The Bank of Japan has yet to establish a position on whether it will step in to defend the 155 level the currency pair is currently brushing up against.
Fears of higher interest rates for longer weighed heavily on US stocks this week. The Nasdaq Comp in particular is already down 3.5% since Monday, the DJI and S&P 500 also losing 0.55% and 2.2% respectively so far.
Uncharacteristically, gold has not set a new record high since Tuesday, content to consolidate under $2,400 an ounce for the time being. Oil prices are down this week following reports of another weekly build in crude inventories; Brent Crude is now back down to $86 a barrel, WTI down to $82.
US inflation figures have consistently come in hotter than expected since the start of the year, every data release increasing fears that interest rate cuts may be pushed further and further down the line. Such fears were all but confirmed on Tuesday during a press conference in Washington, during which Federal Reserve Chair Jerome Powell admitted that the inflation numbers seen so far have not instilled any degree of confidence to end restrictive monetary policy. Powell stated in no uncertain terms that “if higher inflation does persist, we can maintain the current level of restriction for as long as needed”. US jobless claims drop tomorrow, offering further clues about the state of the labour market.
The prospect of higher rates for longer continued to push the Dollar to even greater strengths early this week, the DXY briefly touching 106.5 yesterday. The hardest hit continued to be the Japanese Yen, with USDJPY already approaching the 155 level, up from 153 at the weekly open. There’s a growing sentiment that the Bank of Japan will be forced to step in at some point to protect the Yen, although there has been no official announcement as of yet. Japanese inflation figures are set to be released on Friday, which may offer some clarity to the situation.
Gold started the week strongly, gaining 1.7% on Monday and setting yet another record close at $2,382 an ounce. Despite some chop yesterday that level was maintained to close the day flat. Early trading this morning does not particularly suggest one direction or another.
Risk Warning : Trading derivatives and leveraged products carries a high level of risk.
OPEN ACCOUNT


